The genetics of immunity
A new study links GWAS variants to changes in immune cell dynamics
As was predicted at the beginning of the Human Genome Project, getting the sequence will be the easy part as only technical issues are involved. The hard part will be finding out what it means, because this poses intellectual problems of how to understand the participation of the genes in the functions of living cells.
- Sydney Brenner
Introduction
Nearly two decades ago, the first draft of the human genome was released—launching the field of genomics. More recently, that draft was completed in exquisite detail. Now, we are left with the “hard part,” which is to discern function—how does the genome encode human biology?
One classic approach to decoding the functional role of the genome is to statistically measure the relationship between genetic variation and phenotypic variation. In this type of genome-wide association study (GWAS), correlations between genetic variants and specific traits (often disease, but can be any trait) are detected.1 This type of approach has exploded in popularity, with thousands of GWAS having been performed to date.
This wave of studies has identified many new genetic associations with disease—but it has also produced a confusing phenomenon: the majority of GWAS variants are located in non-coding regions of the genome. That is, we went out in search of the relationship between our genetic instructions (genes) and traits, and found the answers to be outside of the instruction set (the coding regions of genes). I would argue that this general observation has set the research direction for a large portion of the field of genetics. How do we learn the function of non-coding genetic variation?
One big clue has been that GWAS variants associated with disease are more often found in enhancer and promoter regions—which are DNA sequences that regulate gene expression. Researchers have attempted to capitalize on this by building maps of genomic loci that are associated with changes in gene expression. With these expression quantitative trait loci (eQTL) maps, it is possible to do colocalization analysis, which attempts to integrate the eQTLs and GWAS loci to identify locations where the same variant is causal in both types of data.
While this is a lot of specific terminology for those not working directly in genetics, the core idea is simple: the goal of this type of analysis is to identify specific nucleotide variants that change how genes are expressed, and to link these changes in expression to changes in a trait—such as the onset of disease. A portion of the type of variation we see within complex traits such as height can be described by these types of differences in the amount of underlying genes being expressed.
Large projects such as the Genotype-Tissue Expression (GTEx) Project have successfully produced widely useful maps of eQTLs across an enormous range of tissues and organs. These efforts have helped to resolve GWAS loci and to better understand how genetic variation regulates the expression of genes within different tissues. But the story doesn’t end with these maps. The majority of these maps represent static snapshots of the impact of genetic variation on bulk tissues—not individual cell types.
As we continually learn from single-cell genomics, many important biological mechanisms can only be resolved by drilling down to specific cell types that have their own gene expression programs controlling their function. After all, the wide variety of cell types in the human body each share the same genetic information. These cell type specific regulatory programs are essential for carrying out distinct processes with the same genome. This is especially true for immune cells, which have complex regulatory dynamics.
So how can we begin to bridge this gap and link genetic variants to changes in complex gene expression patterns at the single-cell level? Today, I’m highlighting an exciting new preprint entitled “Immune disease risk variants regulate gene expression dynamics during CD4+ T cell activation” which takes an important step towards answering this question. This work was jointly led by Blagoje Soskic and Eddie Cano-Gamez from the Trynka Group at the Wellcome Sanger Institute in the UK.
Key Advances
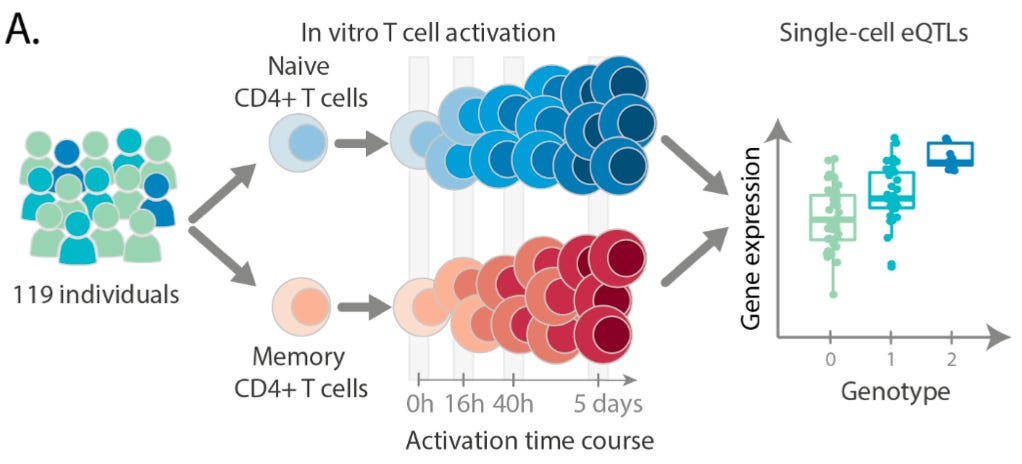
The key focus of this paper was to understand the impact of genetic variation on the regulation and activation of CD4+ T cells. CD4+ T cells, also known as T helper cells, are a crucially important category of immune cell that release small molecules to activate other immune cells, effectively orchestrating the cellular response to a pathogen. To study these cells, this team collected samples from 119 different individuals and generated a data set of “655,349 high quality single-cell transcriptomes spanning four time points of T cell activation.”
As can be seen above, they stimulated the activation of memory and naive T cells.2 The time points (0h, 16h, 40h, 5 days) measured capture the times before and after the cells divided, as well as after the cells had acquired their final effector phenotype as activated T cells.
With their data collected, they performed some of the standard types of analysis used in single-cell transcriptomics. Because the data consists of a large number of cells, each with a large number of measurements (thousands of counts of unique mRNA transcripts), it is incredibly hard to interpret without reducing the number of dimensions being considered. This type of analysis can help detect the latent structure of the data, revealing the biological patterns.3
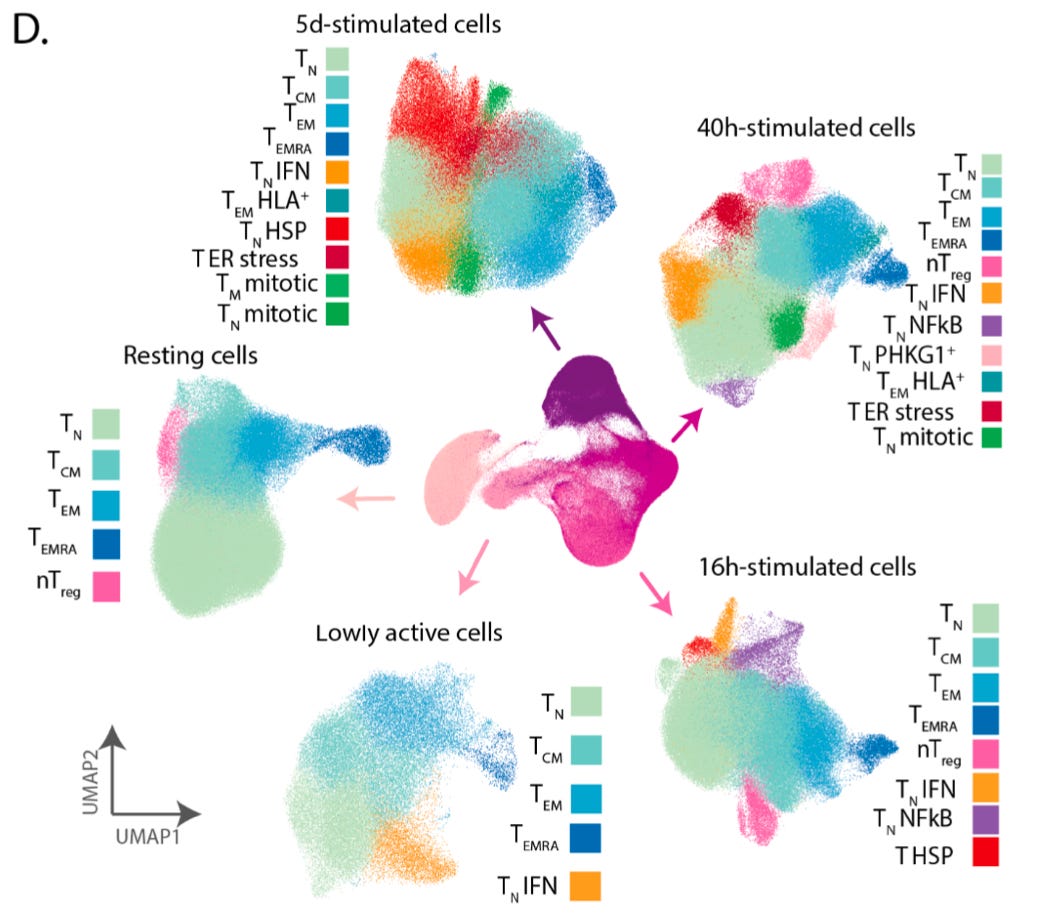
They were able to resolve an embedding of the data using the UMAP technique that recapitulated the progression of stimulation and activation, and the cells along the embedding had known changes in T cell markers.
The additional colors on top of the embedding represent the 38 different cell populations they were able to detect using clustering. This represents what can be done with a high quality single-cell transcriptomics data set, but doesn’t tell us about how genetic variation impacts this process.
In order to address this question, the authors used genetic variation to assign the collected cells back to the specific genotyped individual they came from out of the sample of 119 individuals in the study. With this information, they were able to resolve the “average gene expression profiles per cell type and per individual” and use this information to “between 1,545 and 3,006 genes with significant cis eQTL effects (eGenes) at different activation time points.”
With single-cell data combined with genotypes, this study went much farther than this. They looked at eQTLs within clusters and within immune gene networks. However, one aspect of the analysis that I found particularly compelling was how they modeled the impact of eQTLs through time. This is a subtle but crucially important aspect of genetics that requires the type of data they generated to resolve—the impact of some variants can only be observed within the very precise context in which they operate.
In order to model the impacts of eQTLs through time, they computed T cell activation as a continuous variable through time using a technique called trajectory inference. Next, they split the trajectory into ten different chunks and measured the differences in expression between individuals.
They found “2,265 genes with dynamic eQTL effects, which comprised 34% of eGenes in our dataset.” The effect size for these eQTLs was different based on where you measured its impact within the activation trajectory. Some of these even had complex non-linear dynamics, like CFLAR:
There is a spike in the impact of this locus during the middle of activation, but it was less noticeable at the beginning or end. Again, this meaningful type of variation between the alleles at this locus is only detectable by looking at T cell activation at this resolution.
Importantly, the new eQTLs mapped in this study can be used to better interpret unexplained GWAS variants associated with immune diseases. Here are some of the crucial results of this work: “We identified 471 unique colocalizations, corresponding to 247 GWAS loci for 11 diseases and 314 SNP-gene pairs. This enabled us to prioritize 127 candidate disease-causal genes. Importantly, 77 (60%) colocalizing genes were detected only upon activation, and would have been missed by profiling only ex vivo cells.”
Final Thoughts
One of the most beautiful aspects of genetics is that its explanatory power ranges all the way from populations of organisms down to single cells. In the post-genomic era, one of the fundamental goals of genetics is to link the genetic variation present in the human population to our continually expanding mechanistic description of the molecular world of cells.
This type of explanation holds the promise of helping us better diagnose and treat human disease. It also opens the door to more rigorous “genetic engineering to modulate immune cell functions” with CRISPR which is an active research direction in the Trynka Group where this work was carried out. After all, immunotherapy is one of the most ingenious and successful types of cell-based therapy that has been developed to date. But we have only seen the first generation of these therapies. With a better understanding of the genetics of T cell activation, these therapies could be engineered to be even more effective.
There is another more nuanced lesson to parse from these results. There is a large amount of excitement about direct-to-consumer genetic testing. This taps into the fundamental human curiosity about heredity. We want to know what our genes will tell us about our ancestry, our health, and our risk of disease. As we can see from this work, the answers can sometimes be complex and difficult to spot without careful measurement and analysis.
Genes operate within their environment—the fitness of an allele depends upon the context in which it is evaluated. Different environments can give different answers. It will be important to develop new ways to accurately convey this type of information as we increasingly rely on genetics to inform the way in which we live our lives.
Thanks for reading this highlight of “Immune disease risk variants regulate gene expression dynamics during CD4+ T cell activation.” This exciting preprint combined the power and resolution of single-cell transcriptomics with genotyping and population analysis in order to help explain how GWAS variants associated with immune disease impact T cell activation.
If you’ve enjoyed this post and don’t want to miss the next one, you can sign up to have them automatically delivered to your inbox:
Until next time! 🧬
One technical note: the enabling knowledge and technology for this type of study wasn’t actually the draft of the human genome. It was the HapMap Project which identified the common (>1%) single nucleotide polymorphisms (SNPs) across the human genome. GWAS studies use SNP arrays that look for these known common variants, which is far more cost-effective than genome sequencing.


